Introducing Geo Heatmap Feature
In our new Holistics release (v1.29), we finally unveiled a popularly requested feature: Geo Heatmaps! Our engineering team has been working hard on this behind the scenes for a while now, so we're really excited to share this with you, as part of creating a great Holistics software user experience!
Sorry, your browser doesn't support embedded videos, but don't worry, you can download it and watch it with your favorite video player!
Combining the power of SQL with being able to answer "Where?"
Our new geo heatmap feature allows you to answer key "Where?" questions with your data, such as:
- Where are most of my customers based?
- Where should I have my business operations?
- Where is the most activity taking place?
- Where are my best performing operations located?
- And so on!

Geo heatmaps allow users to easily identify clusters of data on a map, based upon the density of the data points. This means you are now able to visualize behavior patterns in your data you might not have otherwise observed, or give geocoded data context on a commonly shared reference point: a map! Map visualizations gives you a whole new level of location specific contextual insights that would not have been possible with just tables and charts. This is especially helpful for data analysts and product teams who often work with location based data, in industry verticals such as logistics, real estate, hospitality, transportation, ecommerce and more.
Additionally, the Holistics platform allows you to take advantage of the high level of flexibility that SQL gives you to build customizable queries, and by applying this to your geocoded data, this gives you a powerful combination of capabilities to visualize your data and generate insights in a whole new way on a map. Alongside our other Holistics features such as filters and query templates, the kinds of spatial reports you can build with our geo heatmaps feature are truly only limited by your imagination!
Spatial intelligence for everybody!
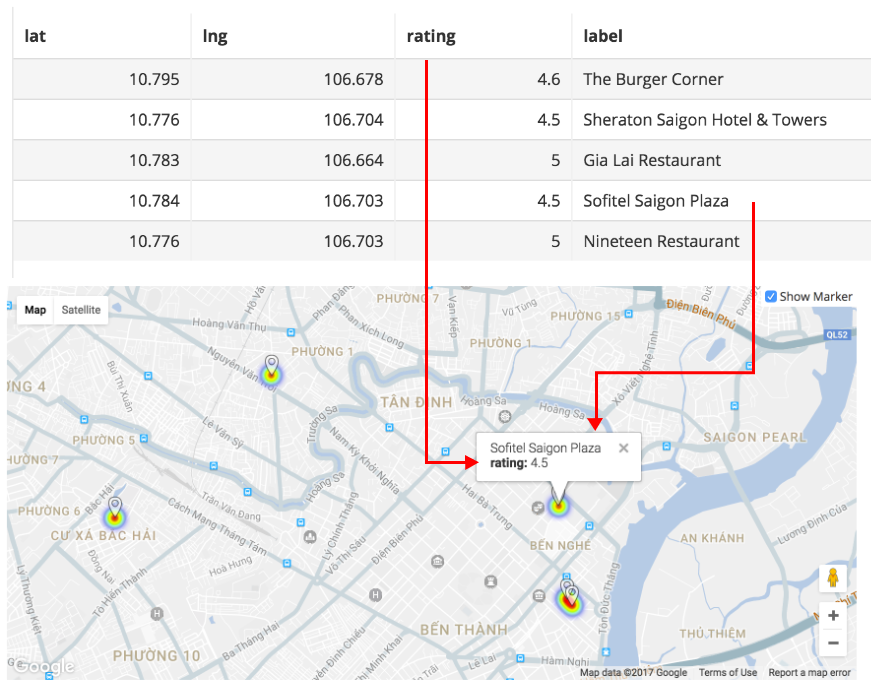
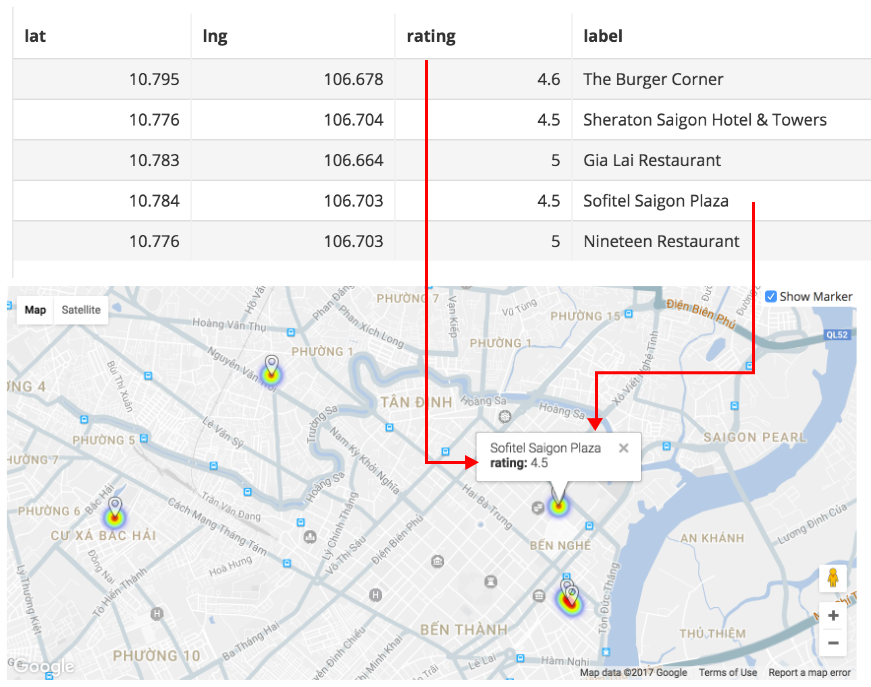
Visualizing your geocoded data in Holistics is easy! The Holistics geo heatmap visualization accepts four columns of data:
- Latitude : The geographic latitude of the data point
- Longitude : The geographic longitude of the data point
- Weight : Used to derive the weight of one point in comparison to the other data points. In this example, the 'rating' column is used for the weight values of the data points in this geo heatmap
- Label : Information labels, which are attached to the individual data points, using the string data type
For more information, you can follow the link here to our documentation page to learn how to build a geo heatmap in Holistics.
Combined with the transactional and operational data queried within your Holistics reports, this allows you to develop highly detailed locational strategies for your business, all within one platform. What was previously the preserve of geographic information system (GIS) specialists now becomes accessible to all your business users, allowing for self-serve spatial analysis and mapping capabilities to be within reach of every analyst without the need of spending years to develop the skills to become a GIS professional! Being able to adjust the zoom level on your Holistics geo heatmaps also means you are able to drilldown to a finer level of detail of your spatial data, as required.
Truly nuanced business intelligence should also incorporate the spatial element of data, using the innate capacity of people to think spatially and visually, in order to develop a more complete geographic intelligence. We are proud to share our new geo heatmap visualization feature with you, as part of our mission at Holistics to enable you to take control of your data and empower your business for growth!
— — — — — — — — — — — —
Having problems finding a simple and affordable data reporting system for your startups? Check us out at holistics.io.