10 AI Data Analytics Tools For Self-Service Analytics in 2026
GPT, Claude, and Cortex are great for ad-hoc analysis, but what if your whole organization needs that power? Here are the best AI analytics tools to scale analysis across your entire company.


Contents
AI as a magical answer machine is a seductive pitch, but anyone who’s worked in real-world analytics knows that most business questions don’t have clean, one-shot answers. They’re messy, ambiguous, and evolving. Without a strong foundation to handle this ambiguity, these systems just guess. Sometimes they guess right. Often, they hallucinate confidently.
Most analytics vendors used to tell you the same story: “Data is too slow. Dashboards are outdated. Just talk to your data, and let AI handle the rest.” But as a company building AI for analytics, I have to confess: the path towards reliable AI has been, and will be, a bumpy ride. There is a flurry of hard problems we haven't completely solved yet: capabilities, reliability, cost, speed, and the most important thing of all, accuracy.
Therefore, the "best", or most useful AI data analytics tools, I'd believe, must be allowed to fail, and must be designed to fail in the right direction. That means surfacing its logic, welcoming corrections, and reusing what it learns. It should act as an assistant with access to your metrics, who can learn through feedback and get smarter over time, not as a magical answer machine, one that sounds too good to be true anyway.
In short, the best AI data analytics tools should be built for this kind of progressive failure. It’ll get things right most of the time, but if it gets things wrong, it’s designed to do so in a way that’s transparent, correctable, and reusable.
With that worldview in mind, I'll write about what you should look for when looking for an AI data analytics tool and the best tools depending on your usage and size.
The Two Types of AI Data Analytics Tools
As someone who's built data tools for the last 10 years, I believe the current AI data analytics tools can be broadly categorized into two levels:
- Text-to-SQL AI analytics tool
- Semantic-aware AI analytics tools
Understanding these two levels makes it much easier to navigate the flood of AI analytics products on the market, especially since new ones are popping up constantly (YC alone launched five AI data tools this year).
Text to SQL Data Analytics Tools
Text-to-SQL tools have been around for quite some time. It'd analyze the database scheme to infer logic, then translate natural language to SQL queries.
It's fast for small, ad-hoc queries and somewhat effective. Better than nothing, you say. But the more you use it, the more you realize that it worked as effectively as a Netflix Original: Occasionally brilliant, mostly unwatchable.
You might type: “Show me revenue by region last quarter.”, and it might return a query counting user_id from a table called events_2021_temp. That’s not what you meant, so you try to teach it how “revenue” actually means gross sales minus discounts, from another schema. It gets confused. The results are technically valid and contextually useless. This happens because there’s no semantic layer or no shared understanding of what “revenue” or “region” means.
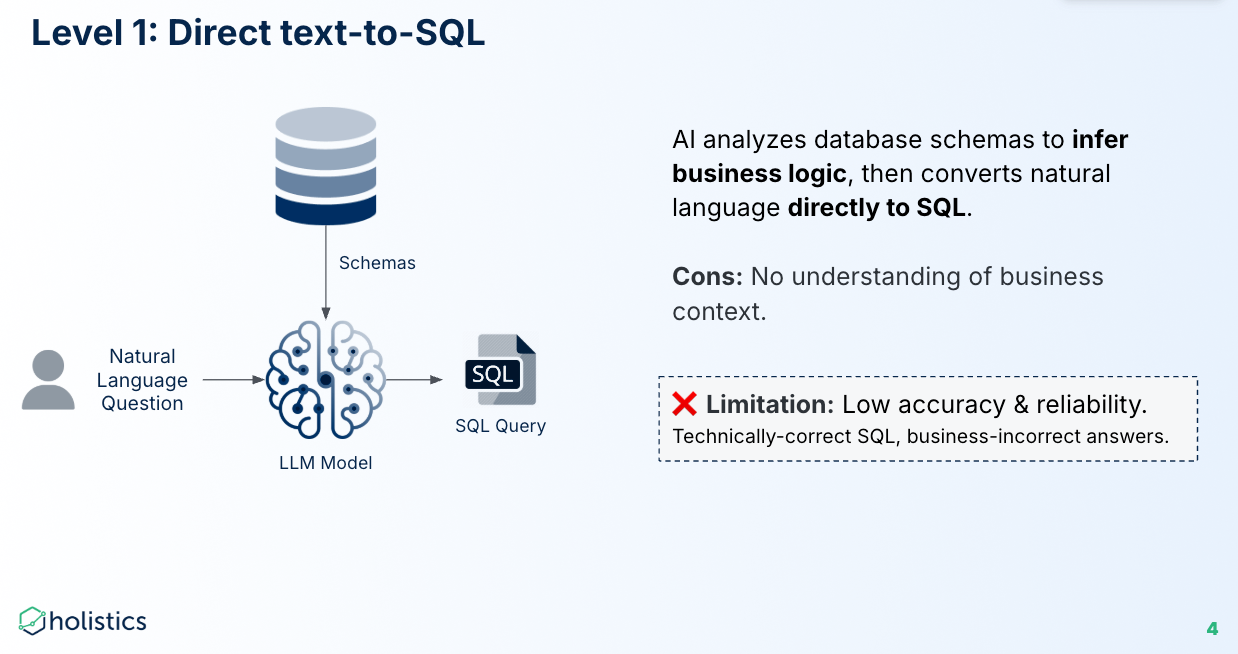
Without business context, AI has to guess at how to translate ambiguous natural language into precise SQL. It’s guessing. Sometimes it guesses well. But most of the time it confidently makes things up.
Semantic Aware AI Analytics Tools
After years of text-to-SQL hype, the market has realized: AI can’t reliably answer business questions without shared definitions. That’s why companies quickly realized the need for a semantic layer: a shared map of business concepts that both humans and AI can understand.
A semantic layer adds business context to raw data: metrics, dimensions, and entity relationships. That’s a big improvement over earlier systems that converted natural language directly into SQL. These tools translate natural language into an intermediary query format, a structured representation that sits between the user’s question and the actual SQL.
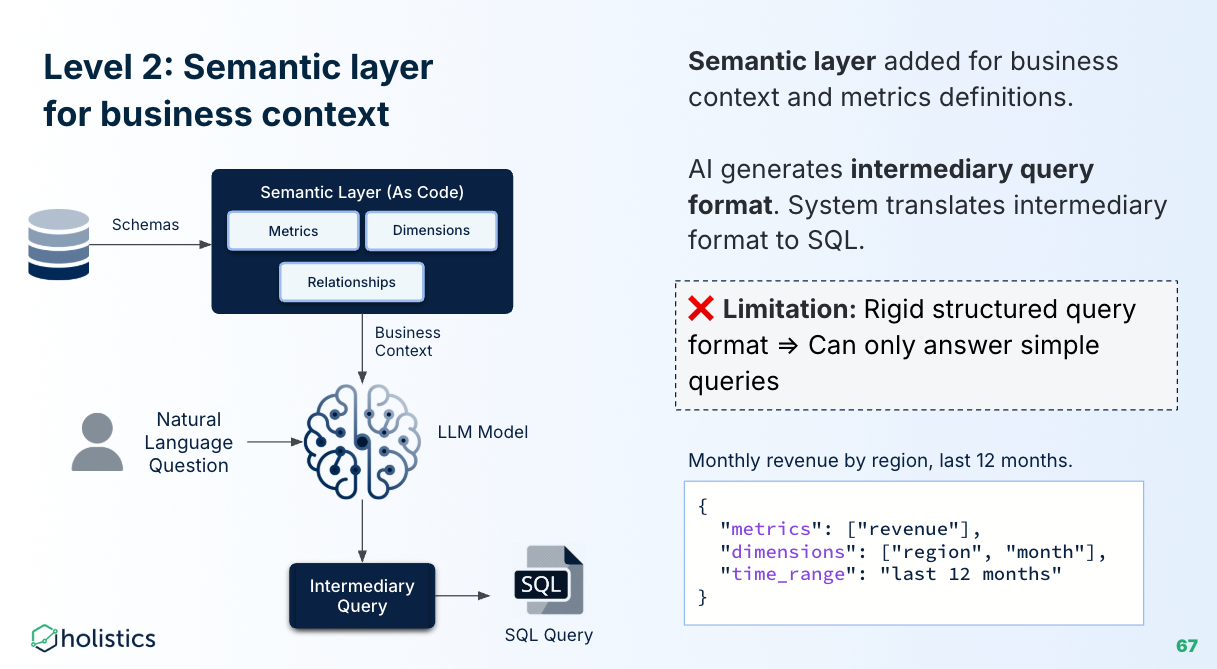
But not all semantic layers are created equal.
Most of them are just wrappers: YAML configs, dashboard annotations, or thin metadata layers that struggle under real-world complexity. Their intermediary formats are too rigid. They resemble structured templates that only allow metric + dimension combinations. They can’t express nested logic, enable modular reuse, or support inspection by other systems. This bottleneck shows up quickly when you try to scale AI usage: Fragile logic that breaks with minor changes, limited analytical expressions (e.g. no PoP, nested aggregations), or inability of AI to compose or extend logic safely.
So what's next???
The Next Level of AI Data Analytics Tools
Most serious data vendors recognize the limits of AI analytics tools, even with a semantic layer in place, and each is taking a different approach to solving them. For example:
- Inspectable AI workflows that that break down every step the AI took to reach its answer, so you can double-check AI-generated results or fix mistakes early.
- Programmable context for AI that lets analysts add programmable logic based on dynamic conditions and user attributes.
- A metric-first, composable query languages that keep AI focused on high-level analytical intent instead of low-level execution details.
- Analytics-as-code that makes it easy for AI to read existing definitions and generate new ones consistently, instead of using intermediaries.
These capabilities are an important signal when evaluating AI analytics tools. You want forward-looking vendors: clear-eyed about today’s limitations, and actively building toward a more reliable future.
How To Choose The Best AI Data Analytics Tools
1. Core Capabilities
An AI data analytics tool should be evaluated by how deeply it supports the full analytics workflow: from querying data to generating visual outputs. Key functional areas include:
Generate answers and visualizations:
- Generates charts from natural language questions
- Creates dashboards that combine charts, filters, and layout logic
- Surfaces insights such as trends, anomalies, or high-level summaries
Explore Data
- Handles filters, aggregations, period comparisons (e.g., vs. previous month), percent-of-total, and rankings.
- Supports complex, multi-step calculations
- Can explain query logic and analyze chart patterns
- Suggests follow-up questions or next steps to guide analysis
Enrich Semantic Layer
- Auto-generates data models and defines table relationships
- Improves metadata with AI-suggested labels, descriptions, and annotations
- Recommends and defines reusable metrics aligned with business logic
These capabilities reduce manual overhead for analysts, improve clarity for business users, and help teams shift from answering “what happened” to discovering “what to explore next.”
2. Data Context and Literacy
AI in analytics only works if it understands not just language, but the context behind the numbers. This dimension evaluates whether the system is data-literate, business-aware, and schema-sensitive.
Base Data Literacy
- Recognizes foundational analytical concepts like “growth,” “breakdown,” “sum,” and “profit”
- Correctly parses comparative terms (“vs. last month,” “top 10 by revenue”) and maps them to valid operations
Business Context
- Understand intent using the semantic model: dataset relationships, field descriptions, and naming conventions
- Leverages semantic definitions to generate business-aligned logic, not just technically valid queries
- Adapts to custom business terms (“qualified lead,” “churned user”) based on the modeled layer.
Database Context
- Understands underlying schema structure using metadata, sampling, and profiling
- Knows what data types are appropriate for filtering, aggregating, or ranking
- Can reason about joins, granularity, and relationships between tables
Result Context
- Interprets and explains what’s actually shown in a chart or insight
- Can articulate, in natural language, what a result means—not just display it
3. Optimizability
A truly useful AI analytics tool shouldn’t be static or locked-in. It should allow teams to improve their understanding of the business, reuse logic, and embed new knowledge directly into the semantic model. This category assesses how well the system enables that loop of learning and promotion.
Improve Business Understanding Through Semantic Enrichment
- Allows users to define new logic and promote it into the semantic layer
- Supports creation of AI-generated calculations that modelers can accept, reject, or modify
- Gives non-modelers (e.g. explorers) the ability to propose or define new metrics that feed back into shared definitions
Improve Analytical Capabilities Through Reusability and Guidance
- Offers reusable templates or query blocks for common analytical patterns
- Surfaces working examples that guide users in building multi-step queries or nested logic
An optimizable AI system should share a consistent understanding of business definitions, and empower analysts to enrich its institutional knowledge through trial-and-error into reusable components so that future users benefit from past corrections.
5. Transparency and Governance
AI data analytics tools that generate metrics, models, or dashboards must be held to the same reliability standards as human-built analytics. This dimension evaluates whether the system is inspectable, editable, and traceable so that users can trust not just the outputs, but the process behind them.
Inspectability
- Shows the logic behind every AI output: which metrics were used, how filters were applied, and how results were calculated
- Allows users to drill into intermediate steps. Makes it clear when logic was inferred, re-used, or modified
Modifiability
- Let users undo or redo changes made by the AI, Supports fine-grained acceptance or rejection of AI-generated elements (e.g., “discard this chart, keep this metric”)
- Encourages human-in-the-loop refinement without having to start from scratch
Version Control
- Tracks changes to AI-generated content over time: who modified what, when, and why. Supports reviewing and reverting to prior versions
- Enables reproducibility and auditability for metrics, dashboards, and semantic definitions
6. Security
This dimension evaluates whether the AI respects existing access controls, protects sensitive inputs, and can be monitored and governed like any other system user.
Query Execution Control
- Enforces dataset-level, row-level (RLS), and column-level (CLS) security
- Respects user-specific database permissions when generating or executing queries
- Ensures AI doesn’t escalate privileges beyond what the requesting user is allowed to see.
Fine-Grain Input Control
- Gives admins control over which metadata, sample data, or query results are visible to the AI
- Allows opt-in/opt-out control for different datasets or environments
- Prevents unintentional exposure of sensitive context through overly broad sharing
Custom AI Credentials
- Supports use of your own AI keys/accounts (e.g., OpenAI, Anthropic)
- Enables cost tracking, privacy control, and data residency management
Logging and Auditing
- Tracks all AI actions and user interactions: what was suggested, accepted, rejected, or edited
- Provides logs for review, compliance, and debugging
- Meets security and regulatory requirements for traceability
10 Best AI Data Analytics Tools for Self-Service In 2026 (Updating)
Following the worldview and capabilities outlined above, here are 11 AI data analytics tools that meaningfully align with these principles and are pushing innovation forward in different ways.
This list is still evolving, we’re continuing to have our engineers test each tool’s AI features before adding or recommending them.
Power BI's Copilot
Power BI’s Copilot is Microsoft’s flagship push into AI data analytics to help its users get more value from their data through natural language interaction and intelligent guidance.
Core AI analytics features:
- Data insights generation: Copilot can analyze datasets and surface insights such as trends, anomalies, and high-level summaries.
- Reports and models summary: It can produce concise summaries of report content, visual elements, and the underlying semantic model.
- DAX query writing: Copilot helps generate DAX queries and measures based on user prompts, reducing the effort required for complex calculations and providing inspiration for analysts.
- Interactive Q&A and narrative visuals: Users can ask questions in plain language, and Copilot responds with relevant visuals or narrative explanations.
What Users Are Saying
Users consistently find it helpful for generating DAX measures, brainstorming calculation ideas, and improving documentation when paired with tools like Claude via MCP. Some also note that its ability to answer natural-language questions about report data works reasonably well, making basic data exploration more accessible for non-technical users.
However, many report that Copilot’s real-world reliability is still uneven.
Its answers are often inaccurate or incomplete, especially for anything beyond straightforward logic. Due to Power BI's limitations with semantic layer, Copilot struggles to understand the full business context, Power Queries, and schema details. This limited visibility means the AI frequently misses crucial relationships in the data model.
Sources of Information
Power BI + AI: Has anyone tried using AI copilots to build reports?
by u/Pangaeax_ in PowerBI
What are your views on Power BI Copilot? Have you tried it? Do you like it? If not, why not?
by u/QuoteMachineMin in PowerBI
Holistics AI
Holistics AI enables end-users to answer complex questions, build dashboards, and extract insights from data without coding, through natural language conversations.
Like others on this list, Holistics is delivering a more reliable AI analytics experience through three foundational innovations: a robust semantic layer, a composable metric-first query language, and an analytics-as-code approach.
- Rich Semantic Modeling Layer: Business metrics, dimensions, and relationships are defined once to provide a comprehensive business context for AI.
- Analytics Query Language (AQL): A composable, metric-centric query language that’s built for AI reasoning. It allows AI to focus on generating high-level analytics logic instead of low-level execution details. AQL comes with a library of pre-built functions that handle common analytical use cases (period comparison, percent of totals, nested aggregations, etc) so the AI model doesn’t have to generate wrangled SQL logic for these use cases.
- Analytics Definitions as Code: Every analytics artifact is text-based code that enables AI to easily read existing definitions and generate new ones. Comes with built-in version control and governance.
Core AI Features
Holistics' core AI analytics features include:
- Natural Language Querying: Users can ask questions in plain English to generate charts, tables, and insights.
- Structured Analysis: Breaks down questions into logical steps, like period comparisons, top N, and percent of total.
- Conversational Follow-Ups: Supports multi-turn dialogue to refine queries and maintain context.
- Transparent Logic: Holistics breaks down every step AI took to get its answer, so you can verify results and work more confidently with AI.
- Metric Reusability: Analysts can refine and promote AI-generated metrics into the shared semantic model.
- Programmable Context for AI: Analysts can provide programmable repo/org-level context to AI to share common and external business logic, customize AI behavior (tone, style, language, workflows), and use dynamic logic with user attributes.
- AI Benchmark tool: AI Benchmark Tool: Helps analysts track the progress of AI optimizations over time and understand how the system is performing.
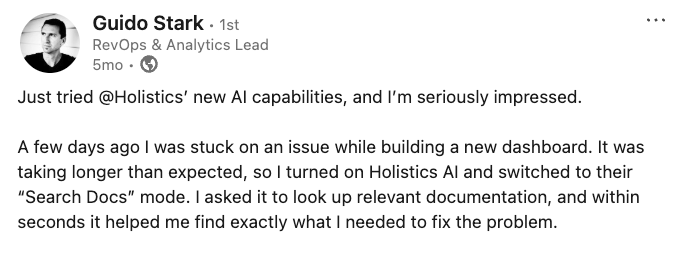
What Users Say
Sources

Sigma Computing
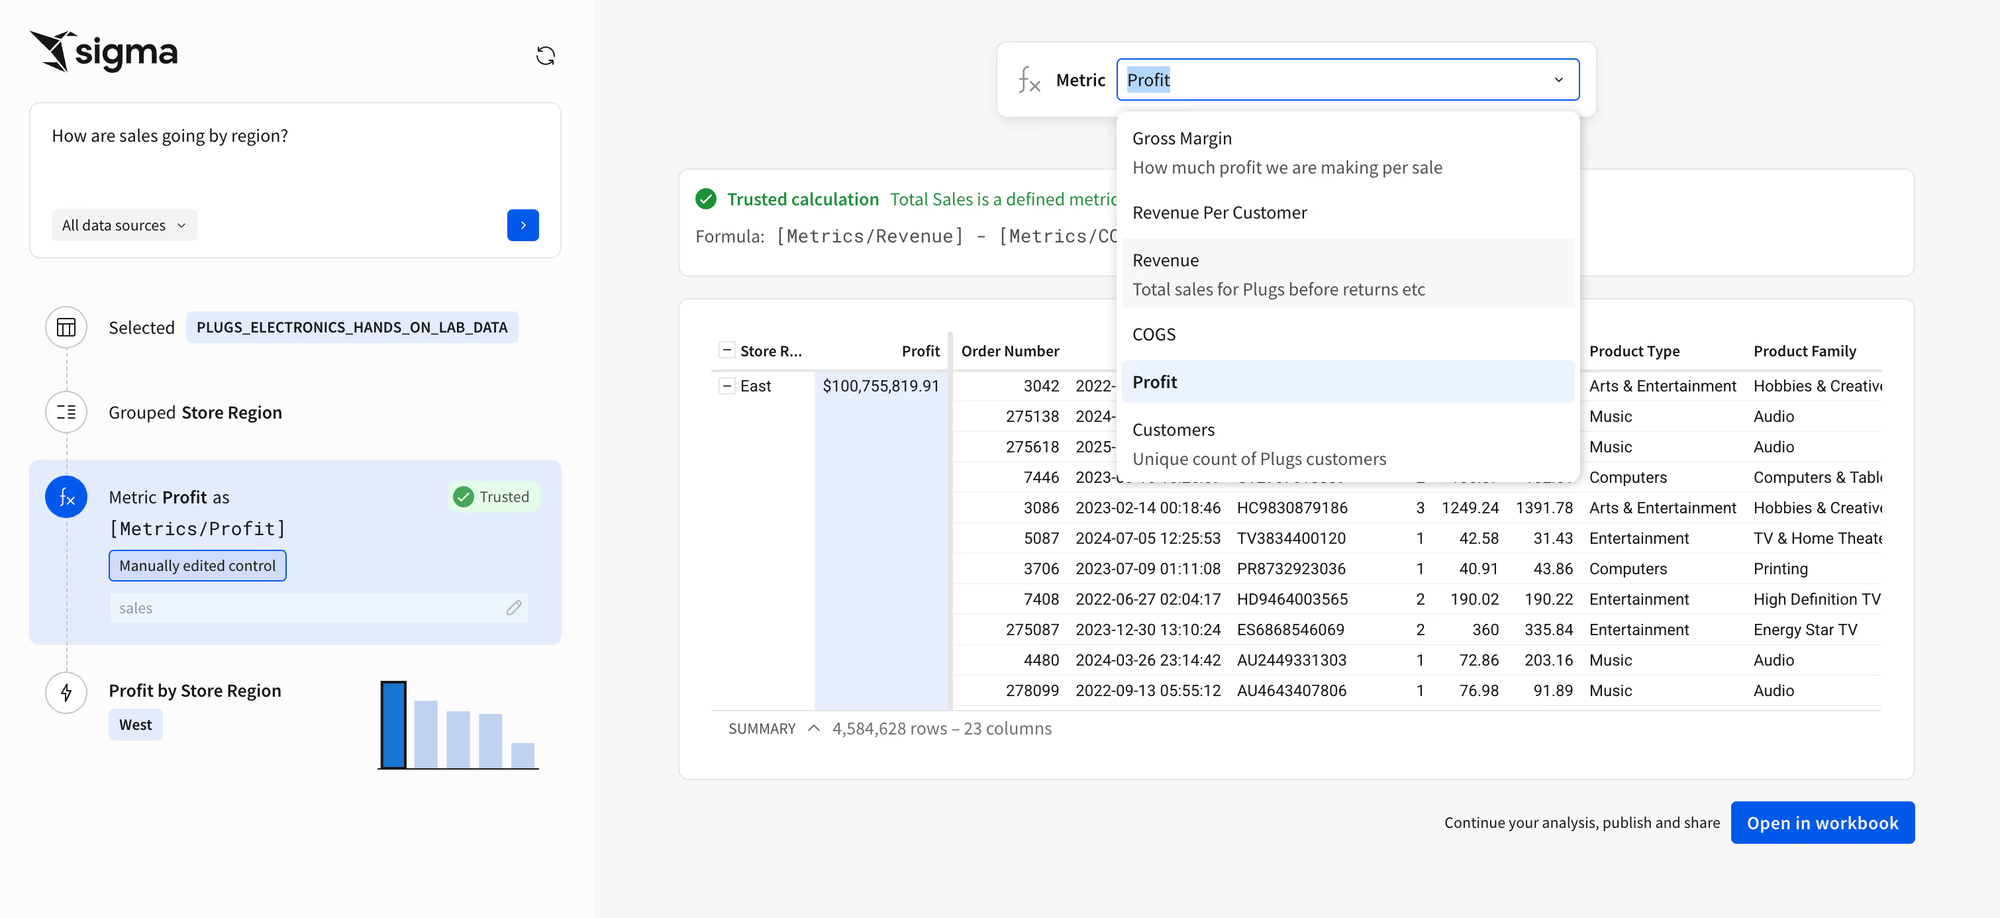
Sigma takes a fairly distinctive approach to AI-powered analytics by tightly integrating AI capabilities with the cloud data warehouse. Rather than treating AI as a front-end assistant, Sigma embeds it directly into the analytics layer, leveraging LLMs via SQL functions and agentic workflows that are visible, editable, and explainable.
Core AI Features
- AI Query (Leveraging Warehouse LLMs): Enables users to call on LLMs (like those from Snowflake, Databricks, BigQuery, RedShift) directly from Sigma using simple SQL functions. This allows for in-platform application of Gen AI functionalities such as summarization, classification, and open-ended prompting on warehouse data.
- Ask Sigma (Agentic AI): A beta feature that acts like a data analyst. Users can ask questions about data, and Ask Sigma will trigger AI agents to locate data sources and build analysis, showing each step of its decision logic. It also breaks down every step AI took to get its answer, so users can double-check and edit any step of the analysis.
- Use AI with Formulas (Formula Assistant): Assists users in writing new formulas, correcting formula errors, and explaining existing formulas.
- ML Forecasting: Allows users to create time series forecasts using warehouse ML functions without needing SQL knowledge.
What Users Say
There isn’t much publicly available information about Ask Sigma’s capabilities yet. We’ll update this section as soon as more details surface.
Covering next:
- Thoughtspot's Spotter
- Julius AI
- Zenlytics
- Lightdash
- Domo AI
What's happening in the BI world?
Join 30k+ people to get insights from BI practitioners around the globe. In your inbox. Every week. Learn more
No spam, ever. We respect your email privacy. Unsubscribe anytime.
