The Best Alternatives to AWS Quicksight in 2026


Contents
QuickSight is appealing for teams already deep in AWS, but its limitations (weak customization, rigid APIs, and poor developer experience) often push data teams to look elsewhere. If you’re scaling beyond basic dashboards or need richer semantic modeling, you’re likely outgrowing QuickSight.
When to look for alternatives to AWS QuickSight
Many teams choose AWS QuickSight because it’s “good enough” and fits neatly into the broader AWS ecosystem. It integrates easily with S3, Redshift, and Athena. Pricing is predictable. SPICE makes querying feel snappy. And it’s simple to share dashboards with non-technical users.
But as teams scale or BI needs mature, the cracks begin to show.
A common pattern is this: dashboards that were fine for a single team become harder to maintain as new business units join in. Visualizations feel clunky. Managing user permissions becomes manual and brittle. And trying to automate or extend QuickSight using its API quickly becomes a source of frustration rather than a lever.
Here’s what consistently drives teams to look for alternatives.
- No semantic layer. Dashboards are built on flat, pre-joined datasets, often giant tables with lots of repeated data. You can’t define reusable metrics or relationships between tables in a central model. This leads to duplication of logic and inconsistent metrics across dashboards.
- No version control. Dashboards auto-save by default. There’s no way to version them unless you manually create duplicates before every change. Collaboration becomes risky and error-prone. Deleting a dashboard from a shared folder deletes it everywhere, including your personal workspace.
- Filters and parameters are convoluted. If you want cross-tab filters or global filtering logic, you’re forced to use a quirky combination of parameters, duplicated controls, and duplicated filters.
- Limited customization. Users often describe QuickSight as rigid. Yes, you can build basic tables, graphs, and maps. But if you want to customize chart elements, or build responsive layouts with polished UX, QuickSight becomes frustrating fast.
- Limited Mapping & geographic features. Teams relying on spatial data have found QuickSight lacking. You can plot points using lat/long, but there’s little support for more complex geospatial logic, like calculating distances or drawing polygons.
- Costly or inadequate self-service options. Self-service only works if your users have Creator licenses, which are relatively expensive. Without those, most users are stuck consuming static dashboards.
- Difficulty promoting dashboards between environments. There’s no first-class support for moving dashboards from development to staging to production. Everything feels ad hoc, you’re either copy-pasting or rebuilding from scratch.
When it still makes sense to use QuickSight
Despite its flaws, QuickSight still has a place:
- You’re running 100% of your stack in AWS
- Your BI needs are lightweight (e.g., executive dashboards, simple filters)
- Cost is a priority, and you don’t need sophisticated data modeling or governance
- You’re mostly sharing static views rather than building interactive, reusable dashboards
But if you're looking to scale BI self-service, empower analysts, or embed rich dashboards, you’ll hit the ceiling fast.
Top AWS QuickSight Alternatives at a Glance
If you’ve outgrown QuickSight, you’re not alone. Teams often hit their ceiling when they need better version control, semantic modeling, or self-service at scale. Fortunately, there’s no shortage of robust BI tools as alternatives.
- Holistics emphasizes governed self-service with a code-first modeling layer and drag-and-drop UI for business users.
- Tableau remains the gold standard for rich visual storytelling and deep customization.
- Power BI offers tight Microsoft ecosystem integration at an accessible price point.
- Looker (now part of Google Cloud) brings robust semantic modeling and governed data access.
- Metabase and Superset serve teams seeking open-source flexibility.
- Domo and ThoughtSpot appeal to enterprises with embedded analytics or search-driven UIs.
- Qlik Sense offers powerful in-memory processing and associative data exploration.
Let's take a closer look.
1. Holistics.io
Holistics is built for modern analytics teams who want reusable, maintainable self-service reporting, without giving up control. It’s a strong alternative to QuickSight, especially for teams that want version-controlled dashboards, modular data models, and analytics engineering workflows.
Redditors have noted that Holistics is especially popular among ex-QuickSight users who needed a more robust, maintainable setup. It’s also frequently mentioned alongside modern data stack tools like dbt and Snowflake.
Why Holistics works well as a QuickSight replacement
- Git-based version control: Everything from data models to dashboard definitions can be versioned, reviewed, and deployed via Git. This directly solves one of QuickSight’s biggest pain points: brittle, click-heavy workflows with no audit trail.
- Code-based semantic layer: Metrics are defined once in code, then reused across reports. You can avoid the copy-paste hell of defining “revenue” in five different dashboards. Analysts can build trusted data models, while business users build off them with drag-and-drop.
- Dashboard-as-code and environment promotion: Deployments across dev/staging/prod are supported. You can treat your BI like software, with change tracking, peer review, and rollback.
- 1-click analytics function: Features like period-over-period comparisons, segmentation, and cohort analysis can all be configured from the UI with. These advanced manipulations are translated into business-friendly actions like “compare this month to last month” or “group by customer segment.”
- Holistics AI: Holistics AI allows business users to ask questions in natural language and get answers as visualizations, powered by your existing semantic models. The data team defines the building blocks, and Holistics AI helps translate intent into queries.
Trade-offs to be aware of
- Requires upfront modeling work: Data teams need to define semantic models first. This pays off quickly, but it’s not plug-and-play out of the box.
- Smaller community: Compared to Power BI or Tableau, Holistics has a smaller user base — but the documentation and support are strong.
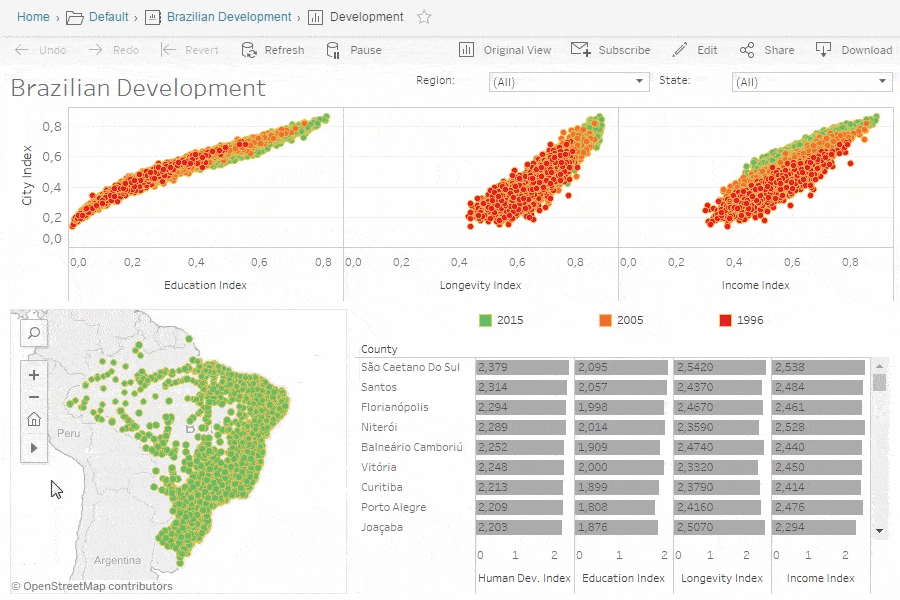
2. Tableau
Tableau sets the bar for visual richness and interactivity in BI. It’s a go-to choice for teams that want deep customization, pixel-perfect dashboards, and a strong community ecosystem.
Tableau makes things possible that QuickSight simply doesn’t. You can build dashboards with responsive layouts, deeply customize visuals, and deliver polished executive reporting experiences. Business users get rich interactivity, with tooltips, drilldowns, filters, and dashboard actions, without needing to write code.
Why Tableau works well as a QuickSight alternative
- Best-in-class visual design: Tableau offers unmatched control over charts, layouts, fonts, and interactivity. If design and UX matter, for executives, clients, or public-facing dashboards, Tableau is the gold standard.
- Deep analytical capabilities: You get powerful calculated fields, LOD (Level of Detail) expressions, table calculations, and flexible parameter control. Things that require painful workarounds in QuickSight are first-class features here.
- Dashboard actions and interactivity: Cross-filtering, dynamic parameter switching, URL actions, and custom tooltips make it easy to build responsive, guided-analytics experiences for users.
- Desktop + Cloud options: Tableau Desktop is powerful for authoring and prototyping dashboards. Tableau Server and Tableau Cloud offer enterprise-grade sharing and governance.
Trade-offs and things to watch for
- Scaling self-service is hard: While power users love Tableau, it’s easy to end up with dozens of siloed workbooks, duplicated logic, and inconsistent definitions. Without a semantic layer or modeling layer, governance becomes a manual job.
- Steep learning curve for authors: Tableau’s interface is powerful, but also dense. It rewards experience, but can be overwhelming for new users trying to build their first dashboard.
- No native Git integration: You can’t track changes to dashboards in Git or CI/CD workflows without third-party tools or hacks.
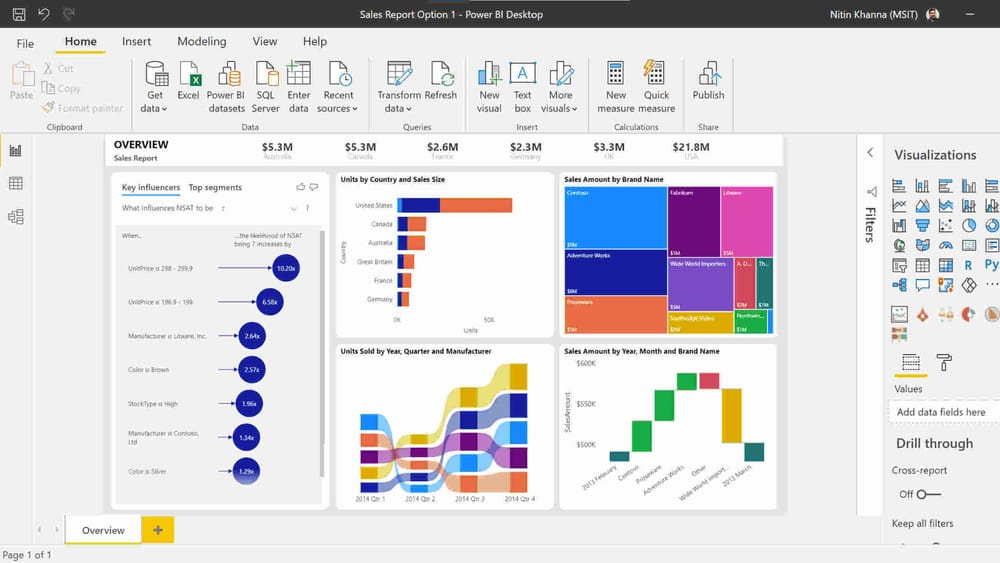
3. Power BI
Power BI is a feature-rich, cost-effective BI platform, especially for organizations already invested in the Microsoft ecosystem.
While QuickSight is often described as “cheap but limited", Power BI offers a deeper feature set, and if your org is already using Microsoft 365, it fits naturally into your stack. It also supports more complex modeling scenarios, including star schemas, multiple fact tables, and reusable DAX metrics, which are all pain points in QuickSight’s flat dataset approach.
What makes Power BI a strong alternative to Quicksight
- Affordable and widely available: Power BI Pro is included in many Office 365 plans, and even the premium plans are cheaper than Tableau or Domo. This makes a broad rollout easier.
- Rich semantic modeling with DAX: Power BI’s data model is powerful. You can define reusable measures and calculated columns, handle many-to-many relationships, and build complex logic with DAX — a steep but rewarding language for power users.
- Excel-native feel: Power BI borrows much of its interface from Excel, which helps business users feel at home. It’s familiar, even if it’s more complex under the hood.
- Growing governance and DevOps features: Microsoft has added deployment pipelines, dataflows, and enhanced access control in recent years, giving BI teams more control and repeatability.
Things to watch out for
- Performance at scale can be tricky: As your data grows, optimizing DAX, indexing, and refresh schedules becomes critical. Power BI has a learning curve for tuning large models.
- Licensing gets complicated: Power BI has multiple pricing tiers (Pro, Premium Per User, Premium Capacity), each with different sharing and compute limitations. Understanding what you need isn’t always straightforward.
- Cloud/on-prem confusion: Power BI’s hybrid model (Desktop, Service, Gateway) can be confusing for new teams — especially if your data is on-prem.
- Limited Git integration: Some recent improvements exist, but full version control still lags behind what tools like Holistics offers.
4. Looker
Looker is built around a central modeling layer that enforces consistency and reusability across your data stack. It’s ideal for teams prioritizing governed metrics, cross-team collaboration, and robust data modeling.
While QuickSight gives you a GUI for creating dashboards, Looker gives you a platform for defining and maintaining trusted metrics at scale. But its proprietary modeling language (LookML) and Google Cloud lock-in can be barriers.
What makes Looker a strong alternative to Quicksight
- Centralized, reusable metrics: Define your KPIs once in LookML, then reuse them across every dashboard, chart, and report.
- Semantic layer + self-service UI: LookML acts as a semantic layer between your warehouse and your end users. Business users can filter, slice, and build visuals, without writing SQL or breaking governance rules.
- Row-level security and access control: Looker supports advanced RLS and column-level permissions out of the box — great for multi-tenant or enterprise use cases.
- Git-based version control: All LookML code is version-controlled via Git. This supports peer review, rollback, and structured change management which is something QuickSight lacks entirely.
- Strong extensibility and APIs: You can use Looker’s robust API for automation, embed dashboards in apps, or push data into operational tools like Slack and Salesforce.
Trade-offs and limitations
- Steep learning curve for LookML: While powerful, LookML is its own DSL (domain-specific language). Analysts need to learn it, and it’s not always intuitive.
- Expensive, especially for small teams: Looker’s pricing is enterprise-grade. It’s great if you need centralized governance, but may be overkill if you just want lightweight dashboards.
- Limited visual flexibility: Looker’s charting capabilities are solid, but not best-in-class. If you need highly customized visuals, Tableau or even Holistics may serve you better.
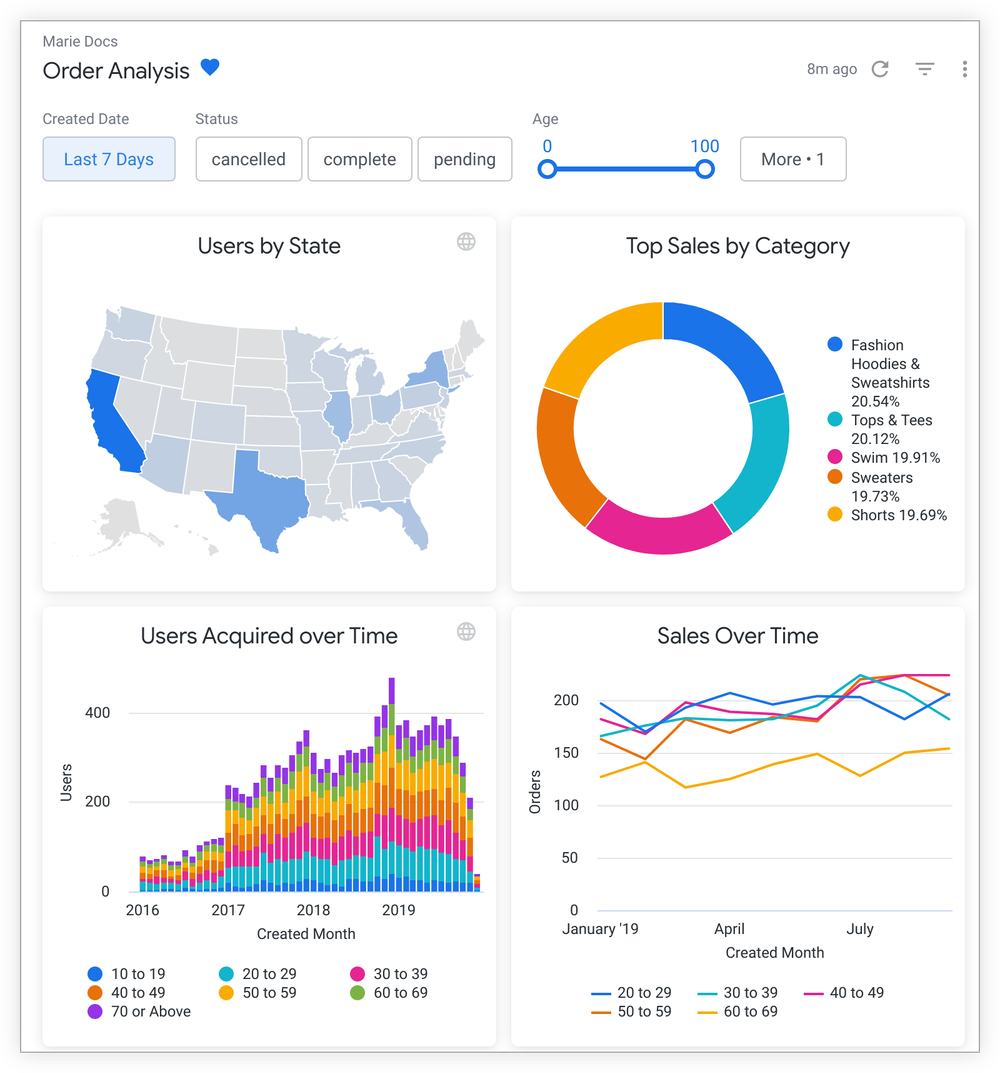
5. Metabase
Metabase is a clean, open-source BI tool that lowers the barrier to data exploration for non-technical users. It’s ideal for startups or cost-conscious teams who want quick wins without a steep learning curve. Compared to QuickSight, Metabase is more intuitive, transparent, and flexible, but it lacks advanced modeling, enterprise-grade governance, and complex visual customization.
What makes Metabase a strong alternative to Quicksight
- Self-service interface: Metabase's GUI is genuinely approachable. Users can explore data, build charts, and ask questions using plain-language prompts or dropdown filters.
- Guided data exploration: Admins can define "data models" (called semantic segments) that expose business-friendly field names and restrict what users can access. It’s not a full semantic layer, but it’s enough for many use cases.
- SQL when you want it: More advanced users can drop into SQL mode at any time. You can write custom queries, use variables, and schedule reports, all without leaving the UI.
- Easy sharing and scheduling: Dashboards and charts can be shared via link or embedded in apps. You can schedule reports to be emailed as PDFs or CSVs, similar to what QuickSight offers.
Trade-offs and limitations
- Limited modeling capabilities: Metabase doesn’t offer reusable measures, join logic, or a true semantic layer. You’ll end up duplicating logic unless you're disciplined with views in your warehouse.
- Enterprise features are gated: Role-based access, audit logs, and embedding require the paid Pro or Enterprise tiers. Open-source Metabase is powerful, but not turnkey for big teams.
- Minimal version control or CI/CD: There’s no native Git integration or environment promotion. What you build in the UI stays in the UI.
6. Qlik Sense
Qlik Sense is known for its powerful in-memory engine and associative data model, which allow users to explore data across multiple dimensions, even when they don’t know what to look for. Compared to QuickSight, Qlik Sense is far more interactive and capable in complex analytics scenarios. It’s especially strong in enterprise environments where speed, flexible exploration, and large-scale deployment matter.
Qlik Sense associative engine doesn’t require predefining joins like traditional BI tools. Instead, users can freely explore connected data and uncover relationships on the fly, even across disconnected tables. This makes it easy to spot unexpected correlations, anomalies, or segment breakdowns that would be hard to find in QuickSight’s flat dataset structure.
What makes Qlik a strong alternative to Quicksight
- In-memory performance: Qlik Sense loads and compresses data into memory, making it incredibly fast for large-scale analysis. You can slice and dice billions of rows with minimal lag.
- Associative model: Unlike SQL-based joins, Qlik’s associative model allows users to explore across related tables intuitively. It highlights both matching and non-matching values as you filter, giving a clearer sense of context.
- Embedded and mobile support: Qlik Sense supports embedded analytics, mobile access, and responsive layouts — making it suitable for both internal teams and client-facing apps.
Limitations and trade-offs
- Not SQL-native: Qlik’s engine abstracts away SQL, which can frustrate data teams who prefer direct control or warehouse-first approaches.
- Complexity for casual users: While powerful, the interface can overwhelm new users. Without strong onboarding, the “freedom to explore” can lead to confusion.
- Cost: Qlik Sense is an enterprise product, and its pricing reflects that. It’s generally more expensive than Power BI or Metabase.
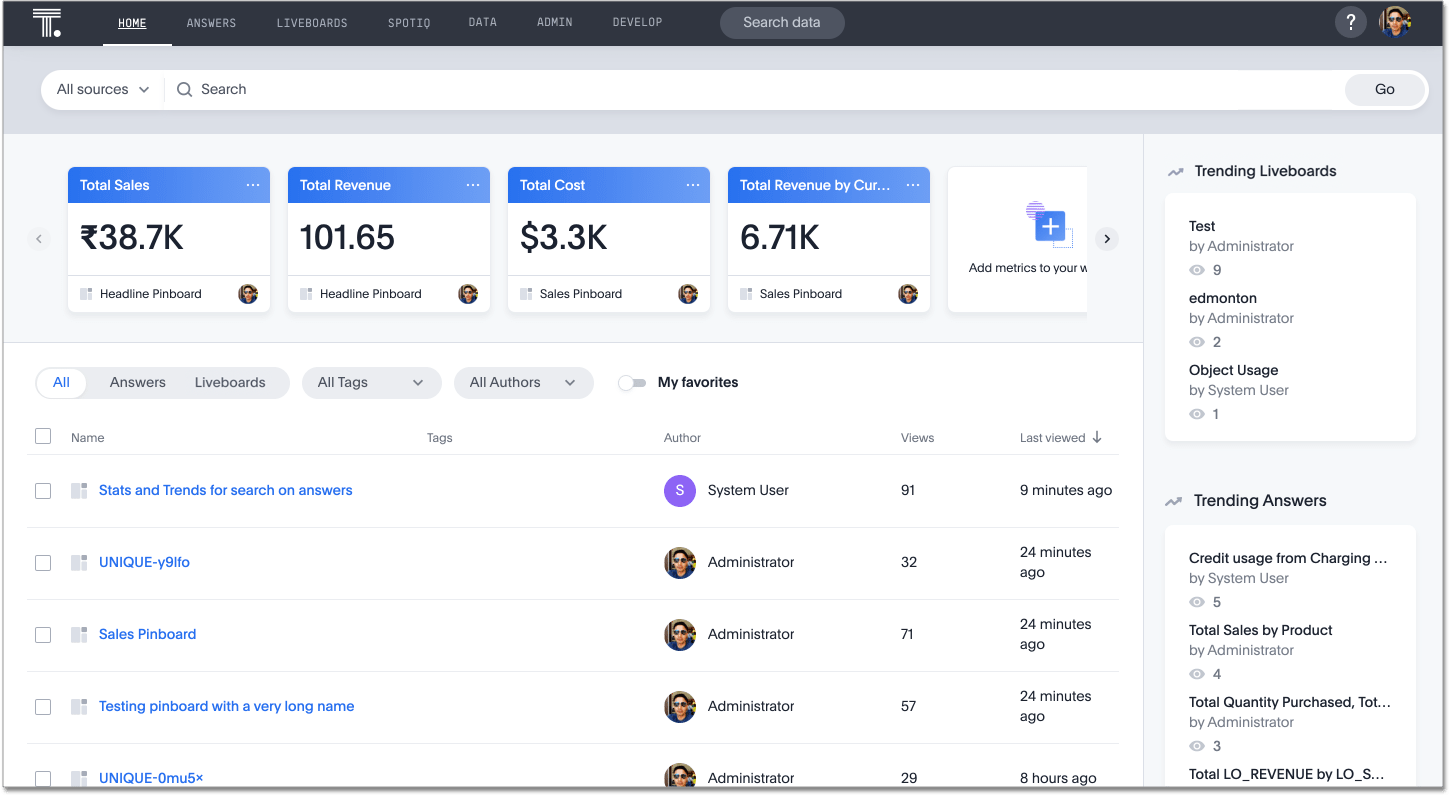
7. ThoughtSpot
ThoughtSpot is designed for business users who want to ask questions in plain English and get answers in the form of charts.
What makes Thoughtspot a strong alternative to Quicksight
- Natural language search interface: Users can explore data using search-like queries. It’s intuitive and fast.
- Auto-generated visualizations: ThoughtSpot turns questions into charts automatically. Users can quickly customize views or drill down to finer levels.
- Live query engine: Unlike tools that rely on imported datasets (like SPICE in QuickSight), ThoughtSpot runs live queries on your warehouse (Snowflake, Redshift, BigQuery, Databricks, etc).
- Spotter for automated insights
ThoughtSpot’s AI engine surfaces trends, outliers, and anomalies automatically. - Embedded analytics & white-labeling: You can embed ThoughtSpot’s search experience directly into SaaS products or portals.
Trade-offs and things to know
- Requires well-modeled data: Search only works well if your underlying schema is clean, relationships are defined, and naming conventions are business-friendly. You’ll likely need a semantic layer or dbt-style modeling upfront.
- Expensive for small teams: ThoughtSpot is priced for mid-to-large enterprises. If you’re a lean startup or cost-sensitive org, it may not be a fit.
- Limited visual customization: ThoughtSpot is focused on exploration, not polished presentation. If you need pixel-perfect dashboards, Tableau or Power BI are stronger.
- Search isn't magic: Natural language interfaces are only as good as your metadata. Users still need to learn how to “speak ThoughtSpot” to get precise results.
Conclusion
QuickSight is fine, until it isn’t. Many teams start with it because it’s easy, fast, and deeply integrated into AWS. But when the need for governance, flexibility, or scale kicks in, it starts showing its limits.
What happens next depends on what you're optimizing for:
- Need governed self-service with Git support and a modern modeling layer -> Go with Holistics or Looker.
- Want polished visuals and deep analytical power -> Tableau is still the most flexible canvas in BI.
- Prefer tight Microsoft integration and cost-effective rollout -> Power BI is the pragmatic choice.
- Building a data product or customer-facing dashboard -> Domo, Holistics, Qlik Sense, or ThoughtSpot gives you strong embedded capabilities.
- Looking for open-source simplicity and fast wins? Metabase, Redash or Superset are great starting points.
What's happening in the BI world?
Join 30k+ people to get insights from BI practitioners around the globe. In your inbox. Every week. Learn more
No spam, ever. We respect your email privacy. Unsubscribe anytime.
