Slowly Changing Dimensions (SCDs) In The Age of The Cloud Data Warehouse
How do you handle Slowly Changing Dimensions when you’re using a cloud data warehouse?
There’s a lot to unpack in that single question, so let’s pause to do that.
In 1996, Ralph Kimball wrote and published The Data Warehouse Toolkit, a classic book that introduced the world to Kimball-style dimensional data modeling. If you’ve ever used a star schema, or if you’ve ever dealt with dimension and fact tables, you have Kimball to thank for his approach.
In The Data Warehouse Toolkit, Kimball describes a situation where your dimension tables change slowly over time. Here’s the example that he used in the book: let’s say that you are a retail store. You sell a bunch of products, and each product belongs to a specific department.

One day, a pedantic staff member with itchy fingers decides to reorganize the products, and reassigns IntelliKidz 1.0 to the Strategy department instead.

At the end of the quarter management asks for an accounting of sales revenue, and they filter this report, naturally, by department. It is at this point that they suddenly discover the numbers don’t match up with the previous report — the same queries now return different results, because the products have been moved around within the departments!
In data modeling, this is known as the ‘Slowly Changing Dimension’ problem, because the updated dimensions that cause these challenges happen very rarely (thus … ‘slowly changing’).
Which begs the question … what do you do?
The Kimball Approach
Kimball proposes three solutions. He names them ‘Type 1’, ‘Type 2’, and ‘Type 3’.
In a Type 1 solution, you do exactly as the pedantic staff member does, above. That is, you update the department column and then you forget about it. This has obvious problems — for starters, you can no longer reproduce older reports that depend on the previous categorization of products. In our example, this is a mild inconvenience. But sometimes it is more than an inconvenience: for instance, when it comes to generated reports that must go to a tax authority, this can be absolutely unacceptable.
The good thing about a Type 1 solution, of course, is that it is simple, and therefore easy to use. It’s also the first thing that you and I would think of. My bet is that Kimball included purely for completeness.
A Type 2 solution is more realistic. The idea here is to add a completely new entry to the product table. In this case, you copy over the old details, but update the product key, like so:

All new transactions in the fact table will now point to the new product key (25984) instead of the old one (12345). This is great: it means that if you want to run a revenue report, the old queries that segment on department will still return the same numbers.
But let’s add a new requirement. Let’s say that you want to see your fact data as if a change never occurred. This is not something that will ever happen with a product table, but it is pretty common when you’re running reports after a sales force reorganization. Kimball writes:
District boundaries have been redrawn, but some users still want the ability to see today’s sales in terms of yesterday’s district lines just to see how they would have done under the old organizational structure. For a few transitional months, there may be a desire to track history in terms of the new district names and conversely to track new data in terms of old district names. A type 2 response won’t support this requirement, but the type 3 response comes to the rescue.
The Type 3 response is to add a new column to the dimension table to capture the previous department. This setup supports the ability to view an ‘alternate reality’ of the same data. The setup looks like this:

Kimball cautions that the Type 3 response is used infrequently. But the three different responses to this problem are essentially the three basic building blocks of tackling an SCD challenge.
In the years since Kimball wrote about these three techniques, numerous other people have presented other types in addition to the original three — though they tend to be hybrid approaches. We’re going to ignore them and jump to the point of this piece.
How Should You Handle SCDs … Today?
We are at a very interesting moment in data analytics. To generalise a little, data professionals pushing the boundaries of the field have begun to question the orthodoxy of adopting everything that The Data Warehouse Toolkit recommends.
Why is this happening? My suspicion is that it’s happening for two reasons:
- First, proper, old-school, ‘four step’ dimensional modeling took up a huge amount of human time. You’ll have to think carefully about the problem domain and the business process you want to model before you create your schema. Kimball adherents would argue that all of this cost is worth it. Contemporary data professionals would agree that some amount of modeling is worth it. The question is: how much? This question has become relevant today because …
- Storage and compute have finally become cheap enough. This turns the normal data warehouse value question on its head. In his classic book, Kimball argued that proper data modeling would give you enormous performance benefits. And it did — for the systems of his day. Today, computing power and storage is cheap, massively parallel processing is a reality, and therefore data team labour is now more expensive than simply paying for raw computing power.
The upshot here is that throwing more computing power at your analytics is a totally valid strategy. And there’s probably nowhere else that we see this more clearly than with SCDs.
How do data teams at the cutting edge of analytics deal with SCDs? In a 2018 talk, Maxime Beauchemin presents a strategy that he’s seen use in Facebook, Airbnb, and Lyft (where, at the time of the talk, he was senior software engineer).
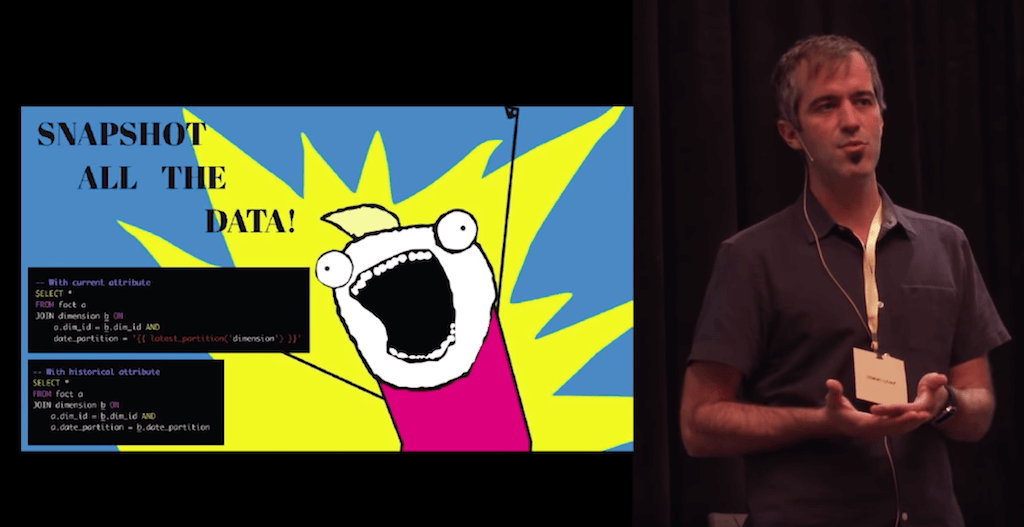
In a nutshell, Beauchemin’s idea was to snapshot all the dimensional data.
What this means is that Beauchemin’s team uses table partitions to segment all the dimensional tables in their data warehouse. Then, every day, an ETL tool (like Airflow, which Beauchemin wrote) would be used to create and copy new daily table partitions as a ‘snapshot’ of all the dimensional data.
Beauchemin then offers three pre-emptive arguments to the natural objections you might have to this approach:
- First, “compute is cheap, storage is cheap. Engineering time is expensive.”
- Second, dimensional data is small and simple when compared to fact data. This means that even a couple thousand rows, snapshotted going back ten years, is a drop in the bucket for modern data warehouses.
- Finally, snapshots give analysts an easy mental model to reason with, compared to the queries that you might have to write for a Type 2 or Type 3 response. (Imagine, for instance, that management wants to know every supplier you’ve ever had over time!) And as a plus, you get perfect reproducibility as a side effect, for ‘free’.
That last point is a big one. Beauchemin presents a sample query like so:
--- With current attribute
select *
FROM fact a
JOIN dimension b ON
    a.dim_id = b.dim_id AND
    date_partition = `{{ latest_partition('dimension') }}`

--- With historical attribute
select *
FROM fact a
JOIN dimension b ON
    a.dim_id = b.dim_id AND
    a.date_partition = b.date_partition
It’s pretty crazy how easy to understand these queries are. A more classical approach would result in vastly more complicated queries, and we’re not even talking about the engineering time needed to execute and maintain those solutions.
The net result? Beauchemin’s approach makes SCDs a non-issue, and you get all these benefits by utilising what is possible given modern data warehousing technology.
Conclusion
I’m writing this post because we at Holistics are currently writing a guide book to a modern data analytics setup. One of the most interesting questions that we’ve been exploring with that book is ‘what does good data modeling look like in the modern, cloud data warehouse age?’
Kimball wrote The Data Warehouse Toolkit in 1996, and updated it in 2002. Bill Inmon wrote his book on data modeling in 1992. It’s been nearly two decades now since these two approaches first emerged, and it’s about time we have a new named approach to data modeling. I don’t know what that would look like, but Beauchemin’s talk and his approach to SCD gives us several important clues.
The most important one, I think, is this: look for places where modern data technology can supplant the effort required for modeling. Whenever you find one, it’ll be likely that you’ve found a chapter in the classical data modeling playbook you can just rip out and leave behind.
Whatever is left in the classical textbook will likely be considered today's best practices.
I can’t wait to see what that is.
To learn more about our upcoming guide book: sign up for our newsletter below. No spam, ever, and we’ll tell you when it’s out.