A Complete Guide to Analyze Pipedrive data with Holistics for Free
This tutorial will show you simple steps to build an interactive dashboard to visualize your Pipedrive data using Holistics.


Cloud-based sales software like Pipedrive has done a lot of work in reducing the workload for your sales team by managing deals and tracking communications with your customers. However, doing sales analytics on your Pipedrive data is often not straightforward.
In this tutorial, I will show you how to build a dashboard reporting your Pipedrive data with Holistics through these 5 simple steps:
- Setup a SQL Database as a Data Warehouse.
- Model Data, Import Data, Transform Data.
- Build and Explore a Dataset to create meaningful visualizations.
- Build Interactive Dashboards with Filters.
- Send Your Dashboard to your email periodically.
What is Holistics?
Holistics is a BI platform that helps you set up and run your data analytics stack. It supports you to consolidate multiple data sources, model your data and generate meaningful insights. It's also free, so you can register and start building your dashboards following this guide.
1. Prepare a Data Warehouse
Data Warehouse is a central database to store data from different sources (BigQuery, MySQL, MongoDB, Google Analytics, Google Sheets...) and optimized for analytical purposes.
Since Pipedrive does not have in-built reporting capability, you need to pull data from it to a SQL database (PostgreSQL, BigQuery, MySQL..) to do reporting.
Checkout these guides if you don't have a Data Warehouse yet
- Set-up Google Big Query for Data Warehousing
- Setup A Free PostgreSQL Database In 10 Seconds using ElephantSQL
After creating your data warehouse, you can connect it to Holistics. Here I'm connecting to my PostgreSQL Database
2. Modeling Data
Data Modeling is the process of applying business logic to make sense of physical data. In Holistics, this process aims to:
- Consolidate data from multiple data sources
- Transform data into a user-friendly form that is easier to query and interpret
- Give business meaning to raw data generated from your system with metadata
- Promote data self-service and collaboration
2.1 Import Pipedrive
In this example, I will make use of Pipedrive sample data.
In Data Modeling page, create a Data Modeling from Data Import, and select Pipedrive. If you have not connected to a Pipedrive account, you will need to get an API key from your account and create a new connection here.
After that, you can select which Pipedrive table to be imported to your Data Warehouse. In the example, I selected all five tables (activities, deals, organizations, persons and stages) for modeling.
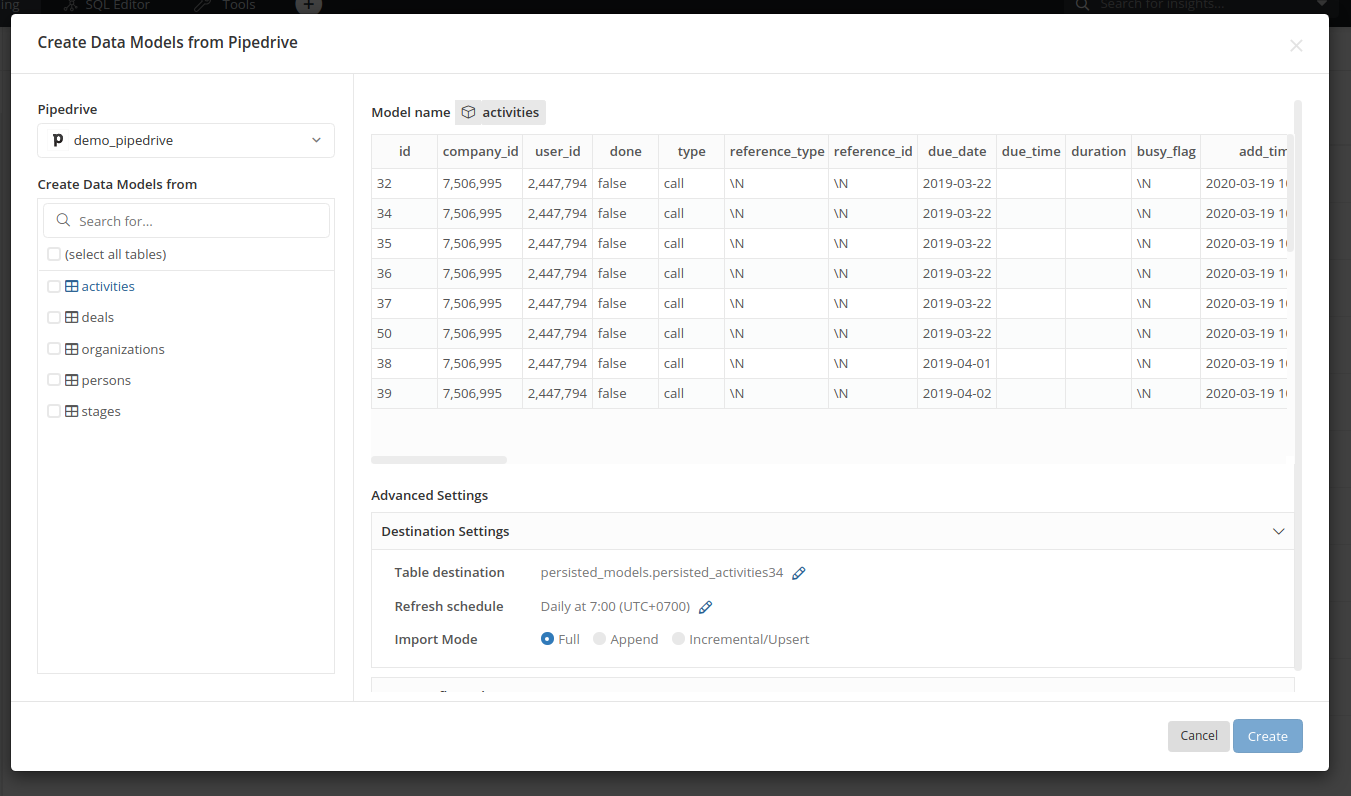
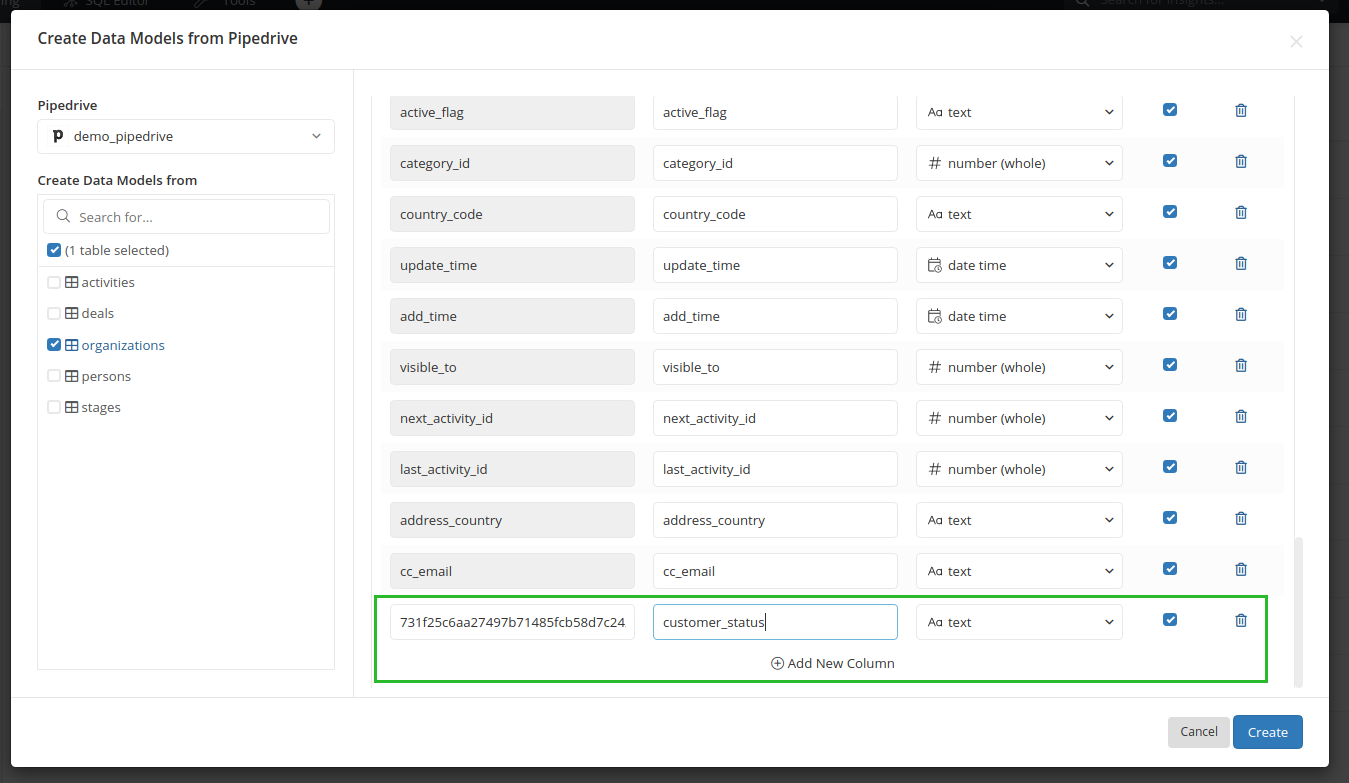
By default, Holistics will load in the default fields of your Pipedrive tables and map them to a proper data type. If your table has a custom field, you have to manually add it using the field key that Pipedrive provided.
This process is beyond the scope of this post so I will leave this for another dedicated post.
2.2 Add Custom Dimensions and Measures to your Pipedrive data
Custom Dimensions are created by using non-aggregate functions to transform one or multiple columns, for example, CASE ... WHEN, CONCAT(), or field_a + field_b...
For example, my deals' currency are not identical (USD, EUR, SGD.), but I only want to report it in USD. I can create a custom dimension named deal_value_usd to convert deal values into USD.
case
  when {{ #THIS.currency }} = 'USD' then ({{ #THIS.value }}::int)*1
  when {{ #THIS.currency }} = 'EUR' then ({{ #THIS.value }}::int)*1.07
  when {{ #THIS.currency }} = 'SGD' then ({{ #THIS.value }}::int)*0.69
  else 0
end
Metric formula is one of the main sources of headaches when different departments report on the same metrics. With Holistics, you can pre-define your calculations in Measures so everyone can have the same definition, and can get insights without writing SQL by themselves.
Measures are created from SQL's aggregate functions and operations such as COUNT(), SUM(), AVG(), SUM(field_a) + SUM(field_b)...
Let's say you business users want to understand average won deal values. You can create a measure called avg_won_value like this:
avg (
  case
    when {{ #THIS.status }} = 'won' then {{ #THIS.deal_value_usd }}
    else null
  end
)
2.3 Add Relationships between models
Adding Relationships to your models allows you to combine fields and measures across models, and answer complex business questions.
For example, there could be a lot of activities around a particular deal so I will link activities data model to deals data model with a many-to-one relationship (n-1) on activities.deal_id and deals.id.
Or you can link your deals model with organizations model by adding an n - 1 relationship on deals.org_id - organizations.id so you can calculate deal metrics across different customer segments.
2.5. Transform your data and Import from other data sources
The steps above only walk you through the basics of working with Pipedrive data. We have not touched on more complex matters like custom fields, data transformation, and combining Pipedrive data with other data sources.
To keep this guide straightforward, I will leave those operations to another post. In the meantime, you can refer to these docs if you are curious about what else you can do:
3. Build and Explore a Dataset
Dataset is a collection of Data Models that share the same interest and have relationships with one another. You can explore a dataset by mixing dimensions & measures from different data models together. Behind the scene, Holistics's engine will generate the proper SQL queries to be run against your data warehouse.
3.1 Create a dataset
I will create a Dataset containing all the Pipedrive data models that I have been working on. All fields and measures from these models will be available in the dataset, and they can be combined thanks to the relationship set up earlier.
3.2 Explore a dataset
After creating a dataset, you can start combining dimensions and measures in a familiar drag-and-drop interface, and select appropriate visualizations.
In this example, I will create a conversion funnel to see deal values through different stages. With just a few clicks and vòila, you got an insightful chart.
4. Build Interactive Dashboards with Filters
What if your viewers want to focus on a specific area of your Dashboard (for e.g., total won deal or deal created after March 2019), that when our filters come and save the day.
Simply click on Add filter icon and choose from five types of filters (Field, Date, Text, Number, True/False) to filter your data. For more information, please visit our docs about Holistics's Filters.
In the example, I want to filter the dashboard by deal type and expected deal closed date. After adding the filters, whenever dashboard viewers change filters' value, it will apply to the mapped fields in the related models.
5. Deliver Insights
Finally, schedule your fresh dashboards to your mailboxes or Slack everyday, so everyone can keep in touch with latest data change and conveniently use data in internal discussions.
Click on Schedule icon on your dashboard, select New Email Schedule. Here you can type in the emails you want to your dashboard to, schedule when to send and overwrite default filter values.
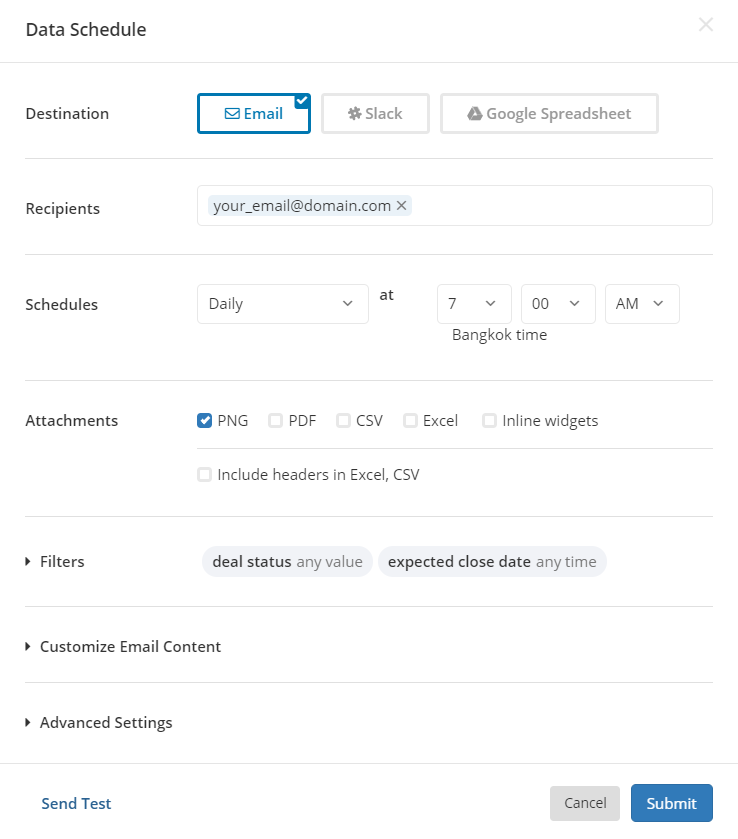
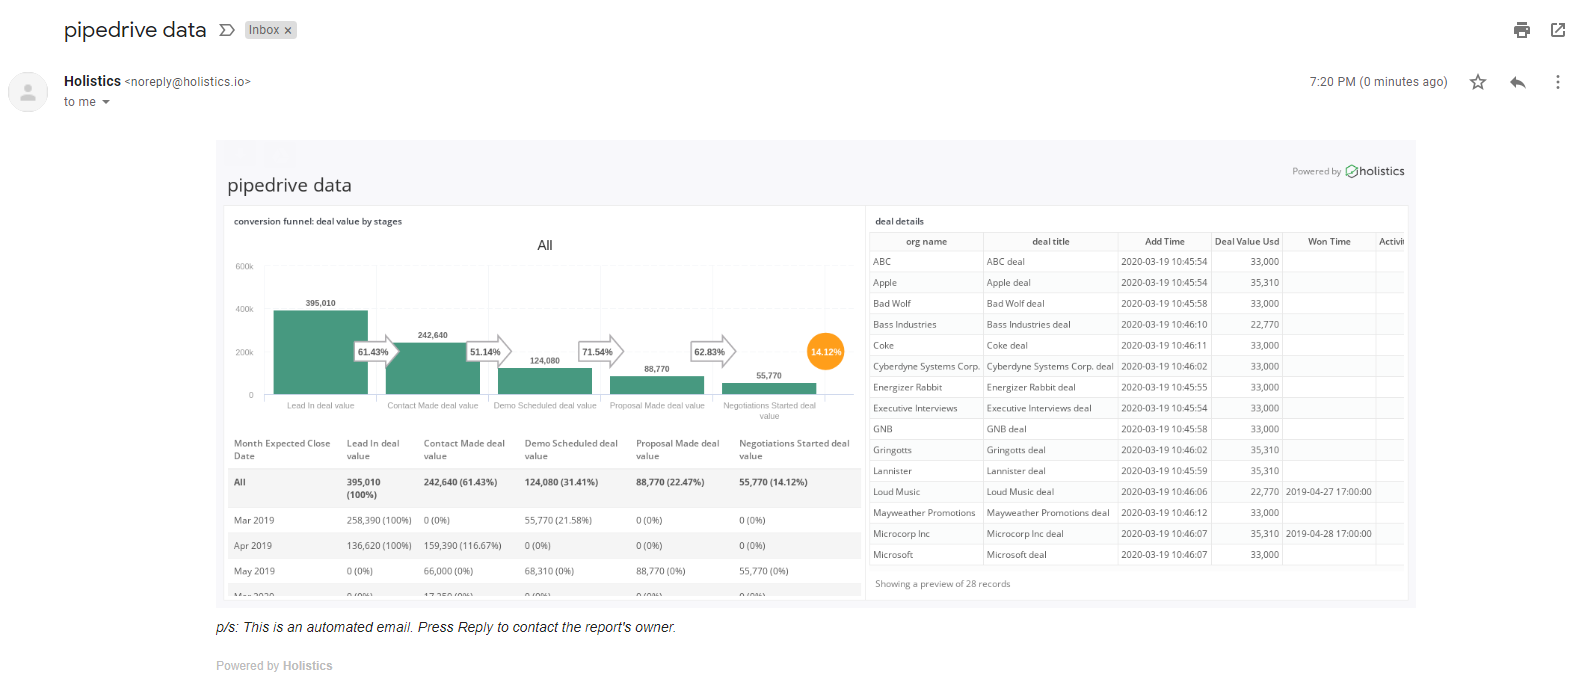
Tada, every 7:00 AM, you will receive a fresh dashboard sent to your email like the one below
Conclusion
I hope this guide explains pretty much the basic concept behind Pipedrive analytics. If you want to check how we build our MRR Dashboard (Using Pipedrive & Holistics), please refer to this link
Now let's jump in and figure out how to apply this guide in your specific use cases!
If you face any problem, do not hesitate to comment or contact me!
What's happening in the BI world?
Join 30k+ people to get insights from BI practitioners around the globe. In your inbox. Every week. Learn more
No spam, ever. We respect your email privacy. Unsubscribe anytime.